As shown in our most recent incident, located at https://asphalt.statuspage.io/incidents/wcr6y1s8h36n. Asphalt experienced an issue in which disk usage was rapidly becoming full, even after attempting to clear log files.
What happened?
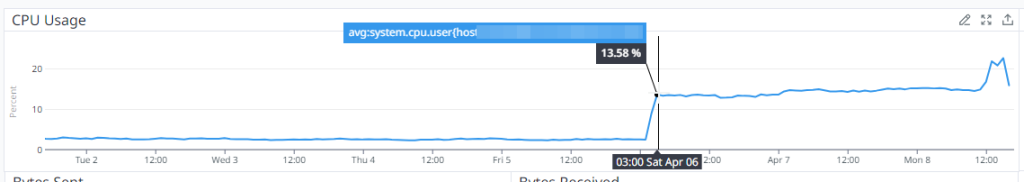
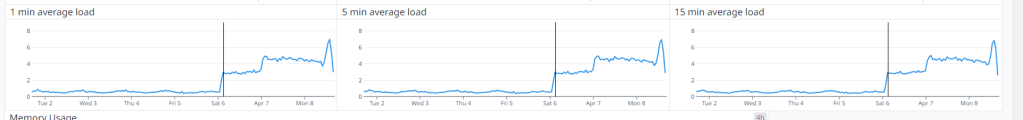
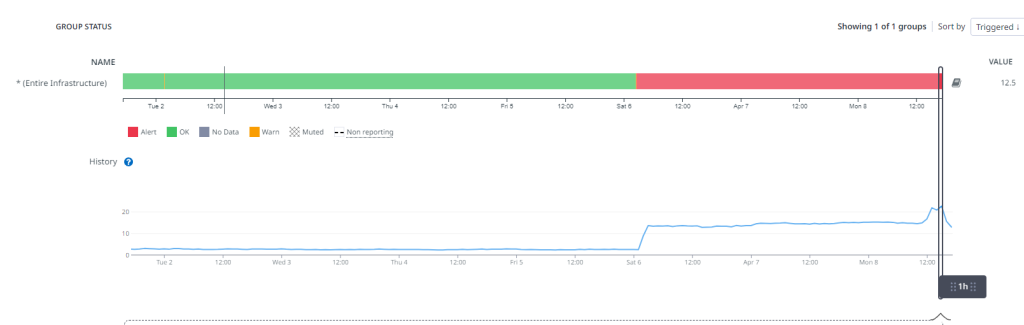
The visible (the part that actually affects users of Asphalt) began at 03:00 on 06/04/2023 UK Time, when CPU, disk and load all simultaneously increased at the same time, as shown by the vertical line in the images below.
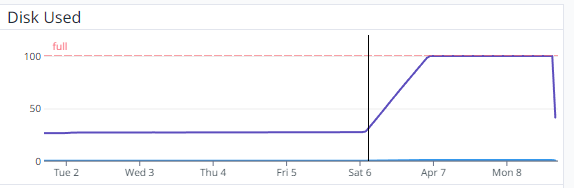
With this, Asphalt started to degrade in performance from 23:00 on 06/04/2023, the time at which there was no more disk space on the server; hourly database backups started to fail, things (such as new inventory items and transaction logs) weren’t able to be stored in the database, causing some data loss during this period.
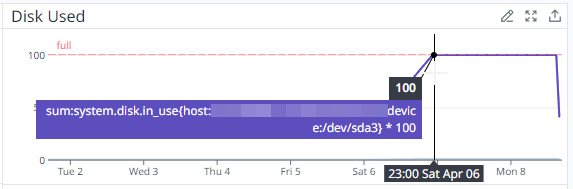
The latest database backup that we have is from 23:00, which is around the time the disk space was completely full.

How did it happen?
We noticed a series of large log files from Docker, totalling just under 600GB. We truncated (emptied) them, and hoped that would solve it. That worked for about 5 minutes, before the log files were that size yet again.
We then discovered that a malicious actor was attempting to brute force (try to login with many credentials, in an attempt to successfully gain access to) our database server, which was causing a flood of authentication attempts to be logged, which then ultimately ended up filling the disk, and contributing to the CPU Usage as shown above, including the average load across 1, 5 and 15 minutes to rise.
Why did it happen?
Unfortunately, there are attempts to attack services like this every single day. (See https://cybermap.kaspersky.com/ for an idea of the scale). This is just one of the things that we need to deal with when running a publicly available service.
In the (incredibly unlikely) event that a breach were to occur, the malicious actor would more than likely download the data, delete it from our database (we have hourly backups to counter this), and then either leak it, or demand a ransom payment to release the data back to us (or sometimes even both).
Why wasn’t it caught earlier?
Unfortunately, our alerting leaves much to be desired, we do have alerting around CPU usage alerts, which were in a state of alert, but we received no notification of this.
This wasn’t also caught by our custom monitoring service, Watchtower (https://watchtower.asphaltbot.com), as it was a degraded performance incident, and Watchtower was developed to catch major/minor outage events.